
About Chart Echo
Chart Echo is an AI-powered market research platform designed to help traders and investors make more informed decisions by analyzing historical market behavior. Instead of relying solely on indicators, opinions, or predictions, the platform searches through years of market data to find historical chart patterns that closely resemble the current setup of a stock or cryptocurrency. By showing what happened after similar patterns appeared in the past, Chart Echo gives users valuable context and probabilistic insights before entering a trade or investment.
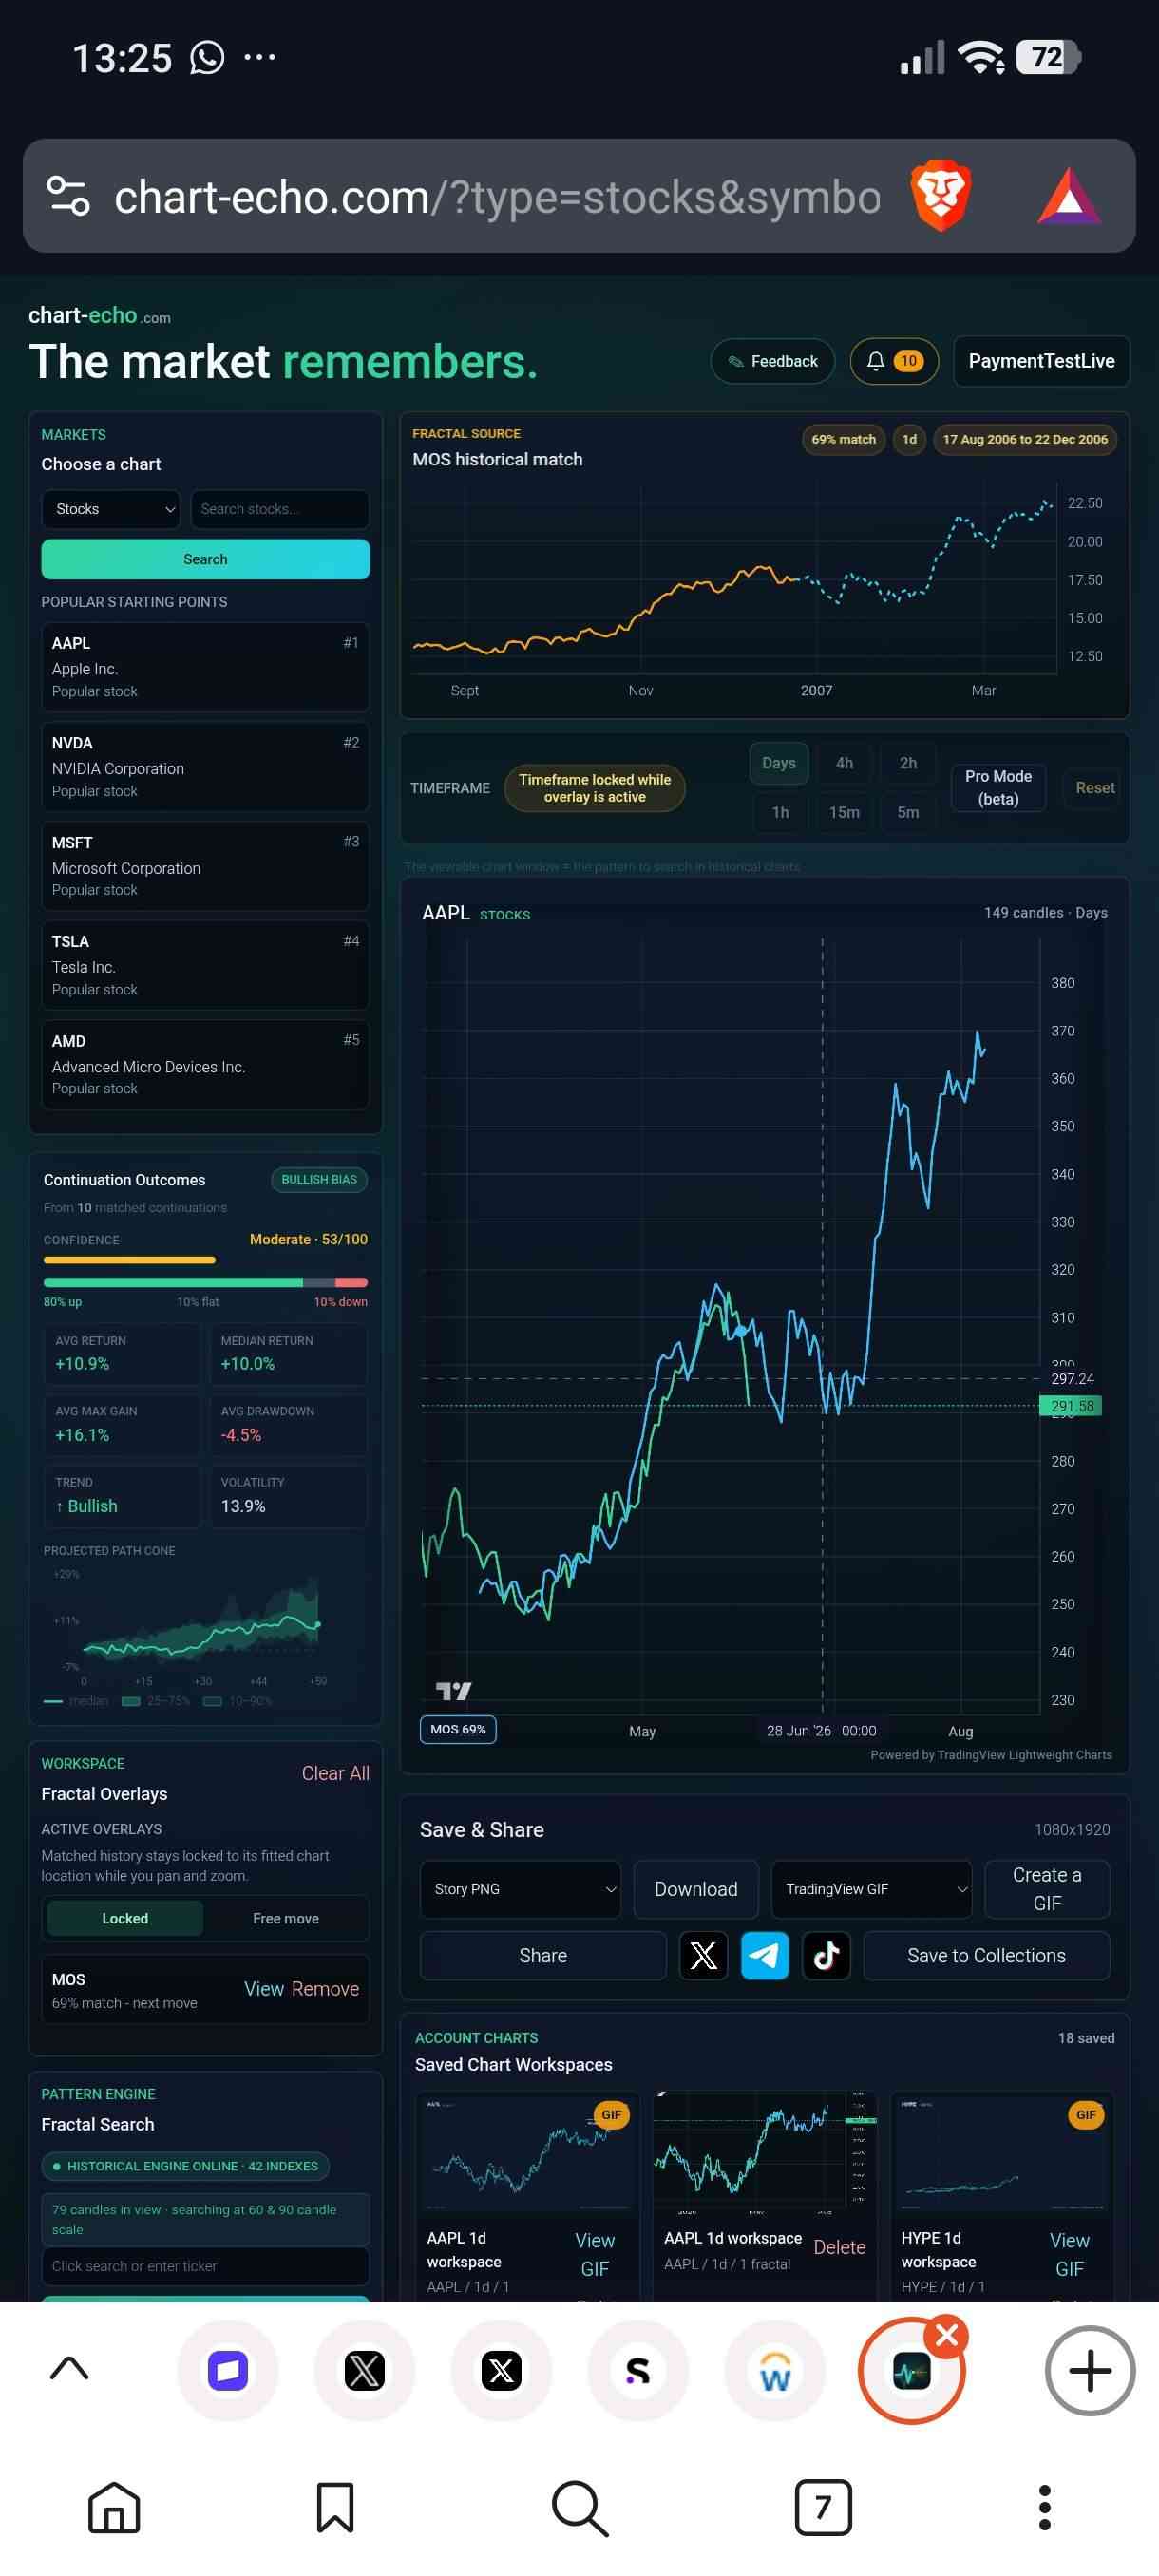
The core idea behind Chart Echo is simple yet powerful: financial markets often produce recurring patterns, and historical price action can provide clues about potential future outcomes. Users can enter the ticker symbol of a stock or cryptocurrency they are monitoring, such as Nvidia, Apple, Tesla, or Bitcoin, and the platform automatically scans millions of historical chart formations to identify the closest matches. Once those matches are found, Chart Echo analyzes what happened next and presents the results in an easy-to-understand format.
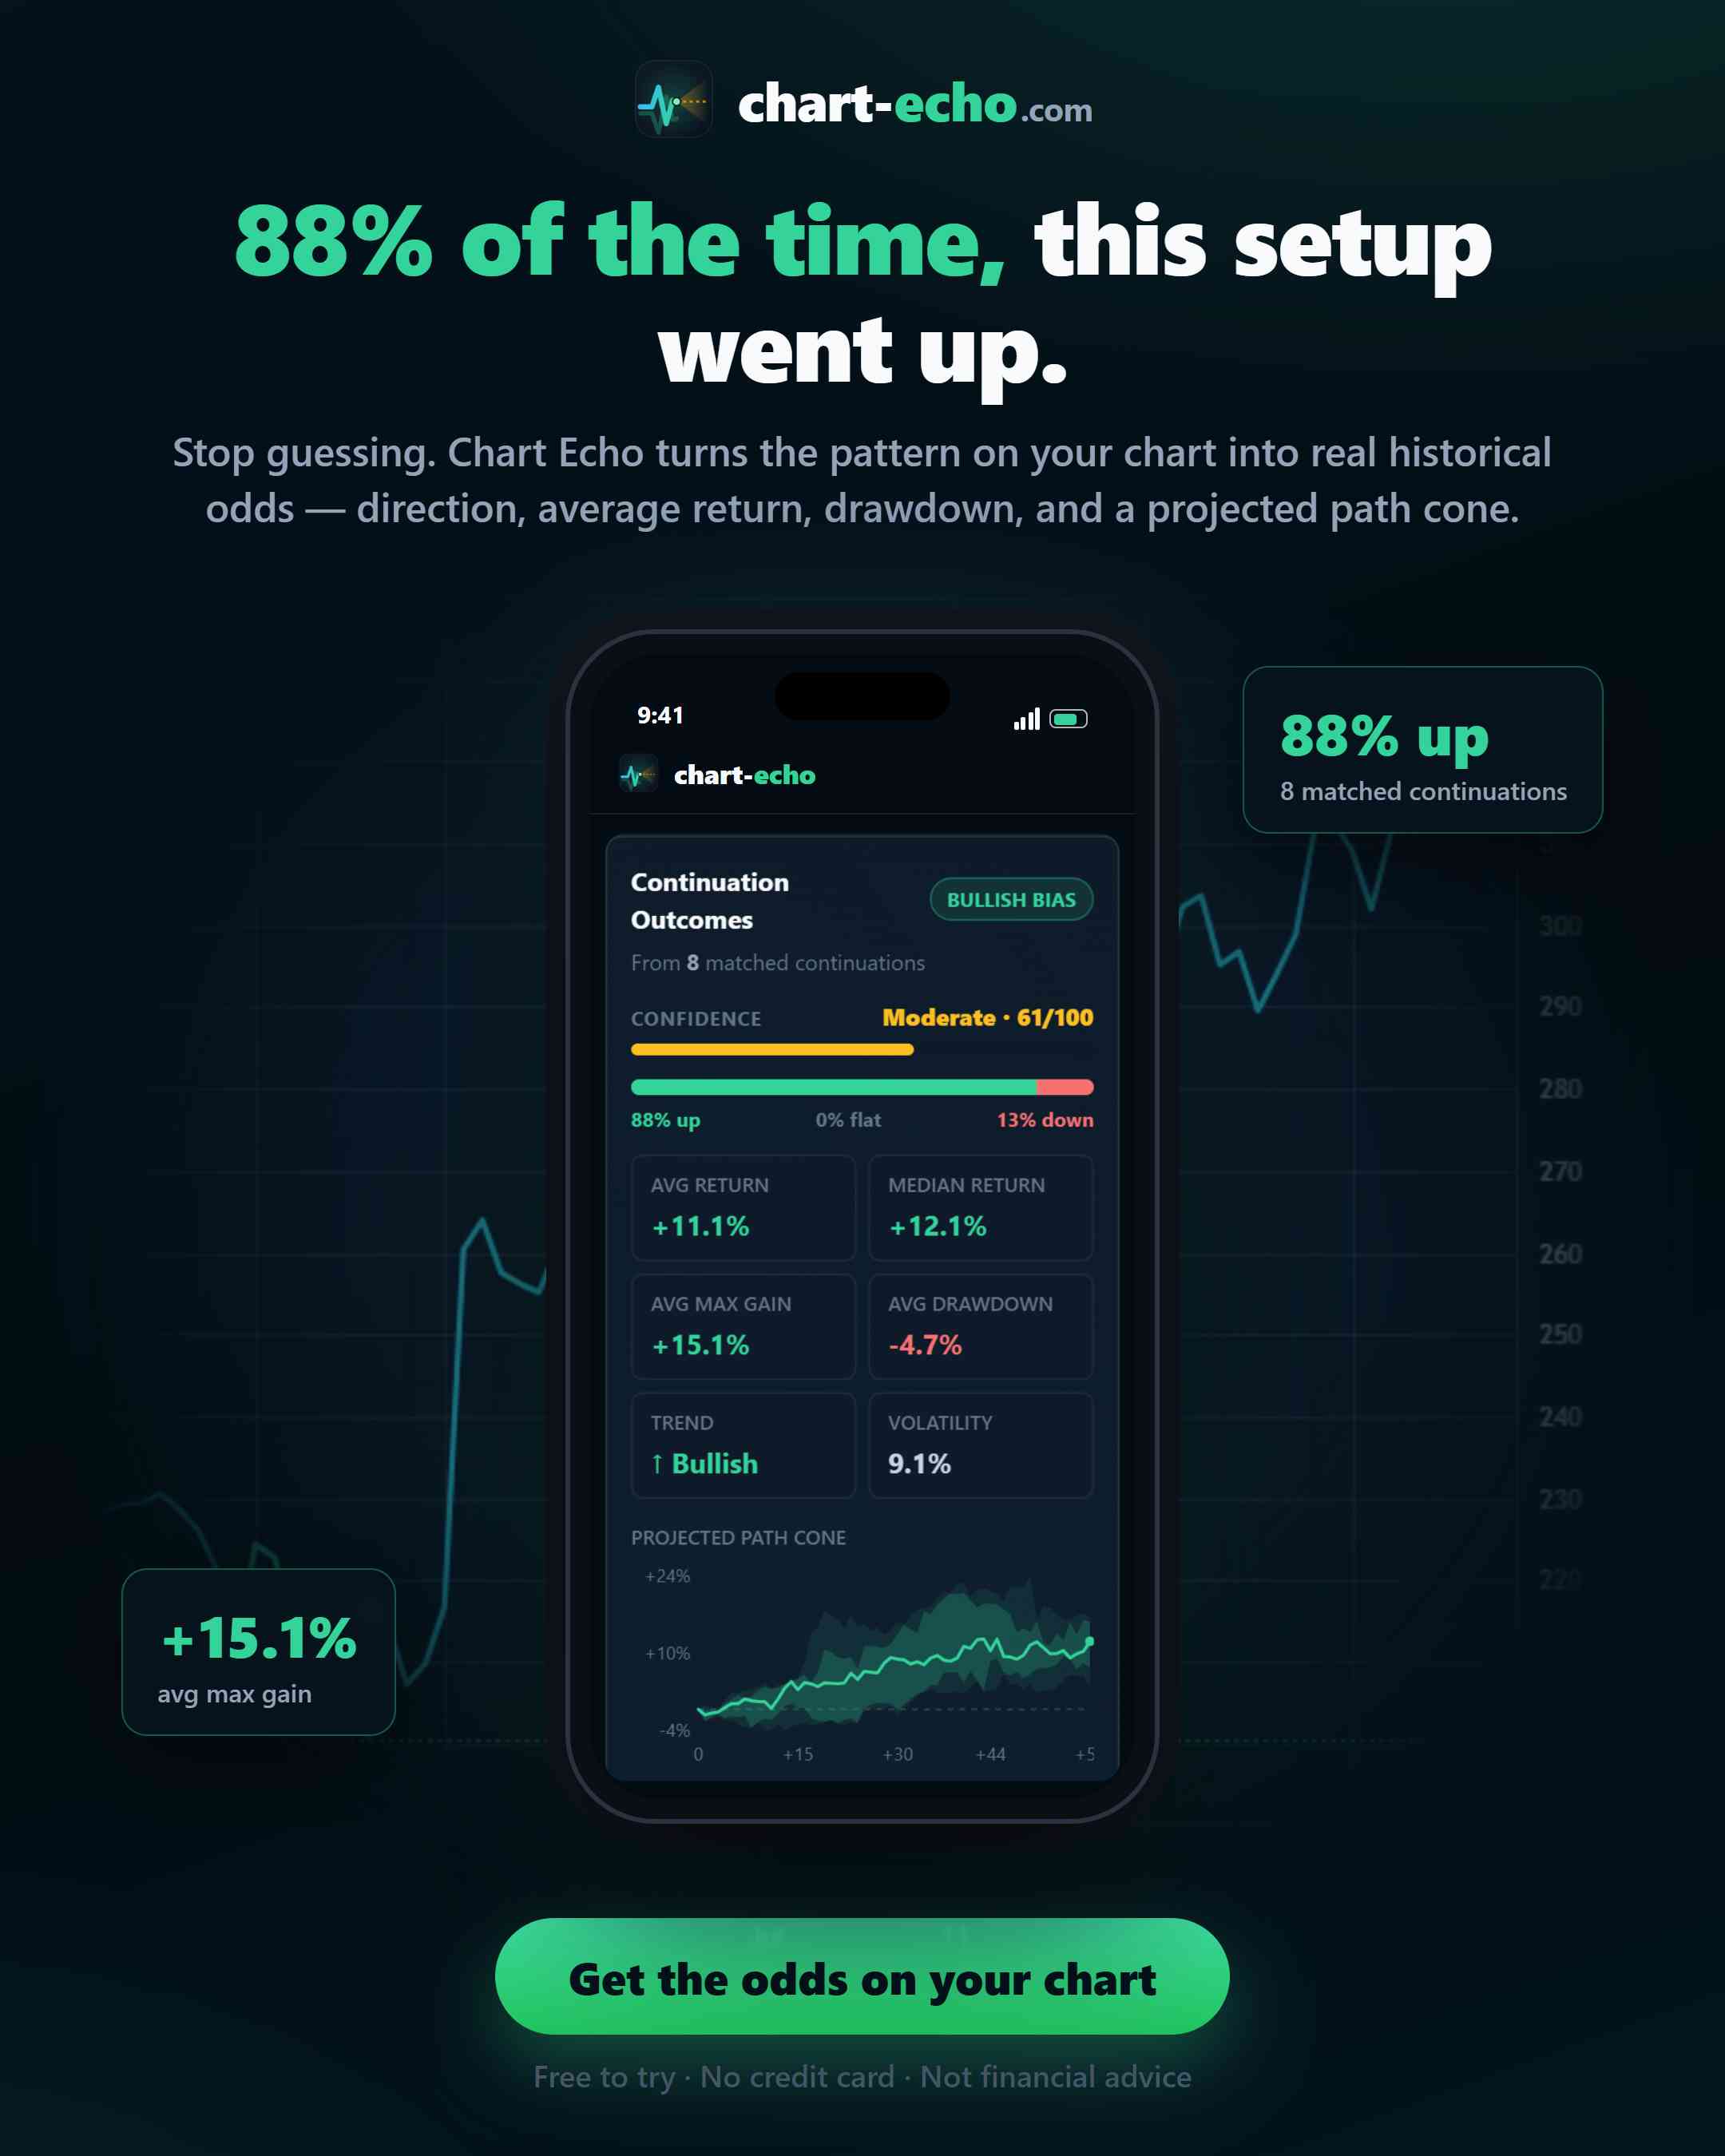
One of the platform’s key strengths is its ability to display continuation outcomes based on historical similarities. Rather than making direct predictions, Chart Echo provides statistical probabilities showing how comparable setups performed in the past. Users can see the percentage of instances that resulted in upward, downward, or sideways movement. This approach allows traders to evaluate opportunities through data-driven probabilities rather than emotion or speculation.
To help users assess risk and reward, the platform presents several performance metrics derived from historical matches. These include average returns, median returns, average maximum gains, average drawdowns, trend direction, confidence scores, and volatility measurements. By reviewing these statistics, traders can gain a clearer understanding of the potential upside and downside associated with a specific market setup. This information can be especially useful when evaluating trade entries, position sizing, and risk management strategies.
Chart Echo supports multiple timeframes, allowing users to analyze market behavior across different trading styles. Premium users gain access to intraday timeframes such as 4-hour, 2-hour, 1-hour, 15-minute, and 5-minute charts, while daily pattern searches are available to all users. This flexibility makes the platform useful for both long-term investors and short-term traders who require more detailed market analysis.
Another notable feature is the platform’s projected path visualization, which helps users understand how historical matches evolved over time. By examining the collective behavior of similar patterns, traders can visualize possible future price paths and better prepare for different market scenarios. While the platform does not provide financial advice, it offers valuable research tools that help users make decisions based on historical evidence rather than guesswork.
Premium subscribers gain access to additional capabilities designed for more advanced market analysis. These include live pattern alerts, saved setup reminders, unlimited chart workspaces, advanced precision controls through Pro Mode, multiple fractal visualization styles, and watermark-free exports. These features make the platform particularly attractive for active traders who regularly monitor multiple assets and require a more comprehensive workflow.

No reviews yet — be the first!
Discussion
Join the conversation
Sign in or create a free account to leave a comment.
Analytics
Unique visitor trends for Chart Echo
No comments yet. Be the first to share your thoughts!